How to Debug
This section gives a short introduction about how to debug the XDK with a JTAG module. The XDK supports J-link debuggers from the company SEGGER with a 9-pin interface. Depending on the functionality, multiple options are available.
For the basic functionality of debugging and flashing bootloader versions we recommend the J-Link Lite CortexM-9 which offers the basic functionality and is comparatively inexpensive.
Connecting the J-Link
In order to utilize the debugmode inside the XDK-Workbench a connection to a J-link via USB must be established, which in return has to be plugged into the 10-pin port on the long side of the XDK. If both devices are connected properly, the XDK is visible in the devices view of the XDK-Workbench and the debug button is usable.

Setting a breakpoint
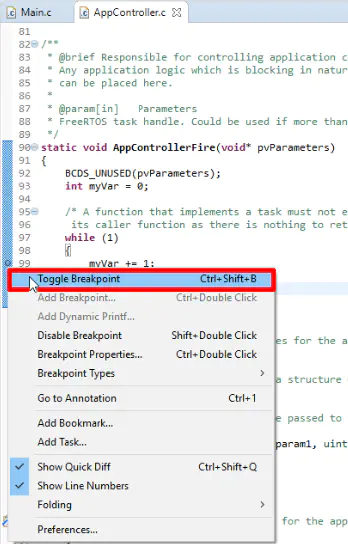
Aside from predefined breakpoints inside XDKs startup process you can set your own breakpoints within a running application. A breakpoint itself is a point in the application, where the application itself will be stopped during the debug process, enabling an analysis of the variables during code execution.
To set a breakpoint in your application right-click -> Add breakpoint or right-click -> Toggle breakpoint, as shown in the image below.

Start debugging the XDK
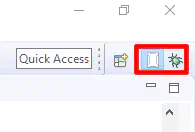
In order to start the debugging process press the debug button in the devices tab, this will start the debug process on the most recent build project. This will automatically open the debug view, which you can also manually switch between by clicking on either the XDK or the debug symbol in the top-right corner of the XDK-Workbench.

The debug view
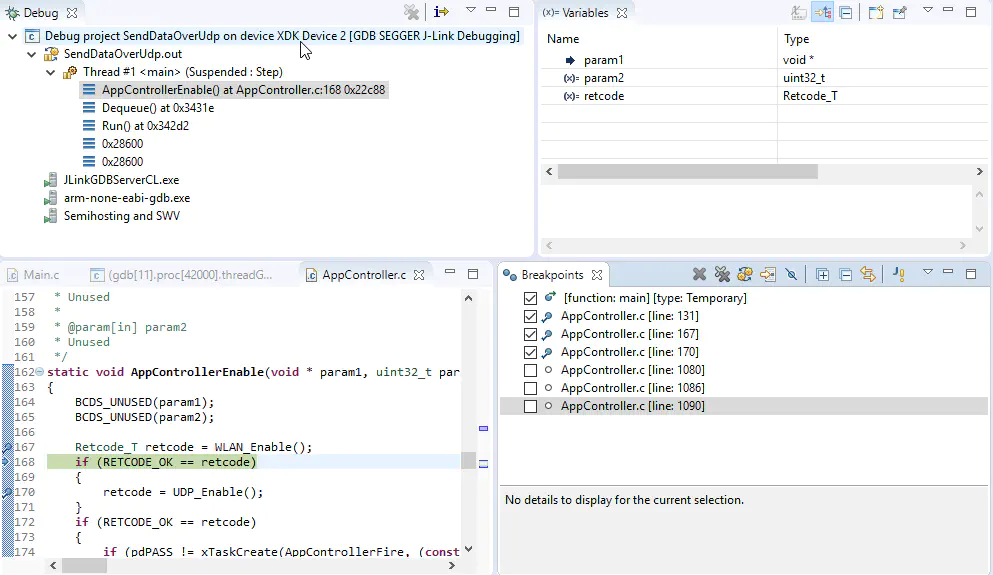
The debug view lists the set breakpoints, variable values during the breakpoints and active threads with the current location inside given thread. When stopped by a breakpoint it will also automatically jump and highlight the location in the code.
